OpenGL Graphing Application
A graphical application which can display an equation or a series of points to the user on a grid. The user can zoom and move the graph around using the keyboard.
The software can:
- Import CSV files to display datasets,
- Display chosen columns on each axis,
- Graph polynomials of any order,
- Display multiple datasets and polynomials at once,
- Scale graph to very small and very large values
Source code and build on github
Development
The first task was to make a 2D OpenGL rendering class which can draw rects, lines and points. The rendering class loads a rectangle and a line into the GPU which it uses for drawing the graph.
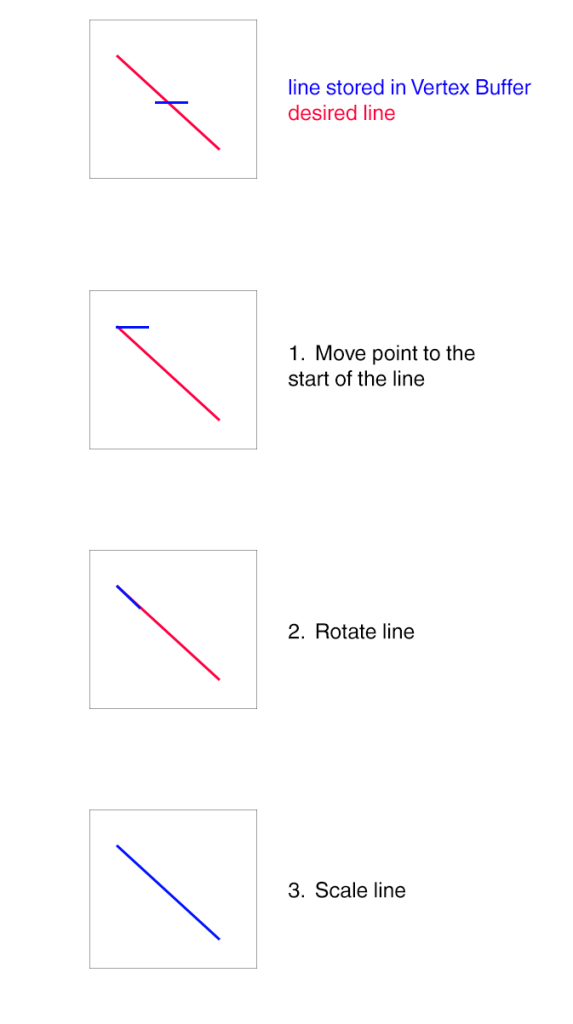
The line drawing function takes two screen coordinates as an input and produces a
transformation matrix to move the line stored in the gpu so that it goes from the first
point to the second. This is the code that does the transformation.
// point1 and point2 are parameters of the function

// create model matrix to transform the line stored in buffer
glm::mat4 model = glm::mat4(1.0f);

// translate line to the first point
model = glm::translate(model, glm::vec3(point1, 0.0f));

// the original line is 1 unit, so compute scaling size
float scale = Geometry::distance(Vector2(point1.x, point1.y), Vector2(point2.x, point2.y));

// create a vector representing the difference of the points
glm::vec2 dVec = glm::vec2(point2.x - point1.x, point2.y - point1.y);

// divide the difference by the scale to get unit vector
dVec = glm::vec2(dVec.x / scale, dVec.y / scale);
// create a vector for the original line stored in buffer
glm::vec2 oVec = glm::vec2(1.0f, 0.0f);

// calculate the difference between the line in the buffer
// and the unit vector of the line to be drawn
float angle = atan2(dVec.y, dVec.x) - atan2(oVec.y, oVec.x);

// rotate the line to the correct angle
model = glm::rotate(model, angle, glm::vec3(0.0, 0.0, 1.0));

// scale the line to the desired size
model = glm::scale(model, glm::vec3(glm::vec2(scale), 1.0f));
Here is a visual explaination of the transformation.
The idea is to have a graph class which can render points given to it on the screen depending on how the graph is scaled or moved. The graph handles converting coordinates from the graph space to the screen space, as well as calling the nessecary rendering functions to draw the grid of the graph and the function or points to be drawn.
Here is an early build of the project with [ y = x * x * 0.1 ] as an input, the grid showing increments of 10 units. This gives an impression of how I want the program to operate at it’s most basic level.
I improved how the graph renders a function so that it does not look jagged when zoomed in. This is achieved by drawing a different series of lines depending on which part of the graph is in view, so zooming has no bearing on the detail of the graph.
A variable grid size was implimented, so it changes as the user zooms in and out. The grid will increase or decrease by an order of magnitude based in the scale of the graph that is in view. The lines of the grid represent intervals of 1EX, where X is some integer. This makes it easier to put sizes into perspective when viewing a function.
Here is the logic that handles drawing the vertical grid lines:
//the order of magnitude of the length of the graph in view
int xSize = (int)log10(graphScale.x / 3);

//the interval of the lines of the graph to draw
double interval = pow(10.0, (double)xSize);

//the position of the first interval along the length in view
double min = roundUp(graphPos.x, interval) - graphPos.x;

//the last interval to draw
double max = (graphPos.x - roundDown(graphPos.x, interval)) + graphScale.x + interval;

//loop through and draw a line at each interval
for (double x = min; x < max; x += interval)
{
//function to draw a vertical line at a given x co-ordinate
      verticalLine(renderer, (x +   graphPos.x),graphTheme.gridColour, graphTheme.gridThickness);
}
The improvements showcased with the function [ y = sin( x ) ]:
I added a graphic class which stores the function or points to be drawn, this makes it easy to draw as many functions or points as possible.
To allow ‘comma seperated value’(csv) files to be imported and columns from these files graphed as points I created a class to load them and extratc data.
The csv files are first loaded into an array of strings, then that data can be exported as a set of x and y points which is loaded into the gpu as vertex data. The renderer then draws the verticies as points, a point shader I wrote converts these points from the graph space to the screen space.
Here is an example line showing how to add the first and second rows of a loaded csv to the graph.
graph.AddGraphic(
	new Plot(csv->get2Col(0, 1),
	csv->getColLabel(0),
	csv->getColLabel(1)));
I also wanted to add a simple user interface, so I used the freetype2 library to import true type fonts, and updated my renderer to handle drawing strings at a given position with a given size.
The font is imported, and bitmaps of the characters are created and loaded as textures on the gpu. A map links the character to be drawn to the saved texture.
// iterate through the string to be drawn
std::string::const_iterator c;
for (c = text.begin(); c != text.end(); c++)
{
// get a pointer to the current character
	Character* cTex = Font->getChar(*c);
// if the character doesn't exist in the font, skip.
	if (cTex == nullptr)
		continue;

// use the proporties of the character to get a position
	glm::vec2 thisPos = position;
	thisPos.x += cTex->Bearing.x * size;
	thisPos.y += (cTex->Size.y - cTex->Bearing.y) * size;
	thisPos.y -= cTex->Size.y * size;
// get the dimentions of the character
	glm::vec2 dim = glm::vec2(cTex->Size.x * size, cTex->Size.y * size);

// get a transform matrix that transforms the quad in the
// vertex buffer to the size of the character to be drawn
	glm::mat4 model = getModel(thisPos, dim, rotate);

// set the model in the shader
glUniformMatrix4fv(_textureShader->Location("model"), 1, GL_FALSE, &model[0][0]);

// bind the character's texture
	glBindTexture(GL_TEXTURE_2D, cTex->TextureID);

// draw the quad
	_quad->Draw(GL_TRIANGLES);

// advance the current position to where the
// next character should be
	position.x += cTex->Advance * size;
}
The ability to draw strings allows for information about the position and scaling of the graph to be displayed, as well as lables on the x and y axis. This also allows for buttons to be implimented, which make interating with the software more intuitive.
The video below demonstrates the progress these additions make:
Next I added the option to choose which collumns of the csv file to plot, and what kind of polynomial to graph, which can be seen in the video at the top of the page. I used a drop down menu to show imported csv files, so different collumns can be plotted against each other from the same dataset.
The drop down menu works by linking a button to a menu(which is a series of buttons). The button does not nessecarily need to be clickable, but it can be if desired.
Here is the update loop for the drop down menu
// check if cursor is on button or menu (if dropped)
if (button->Hovering() || (DMenu.Hovering()))
	dropped = true;
else
	dropped = false;
// update menu when mouse is ontop
if(dropped)
	DMenu.Update(xPos, yPos, pressed);
A menu can contain a button which links to a drop down menu, so drop down menus can be embedded within each other.